

Blog
Statistic Counter on Scroll with jQuery and CSS

Statistic Counter on Scroll with jQuery and CSS
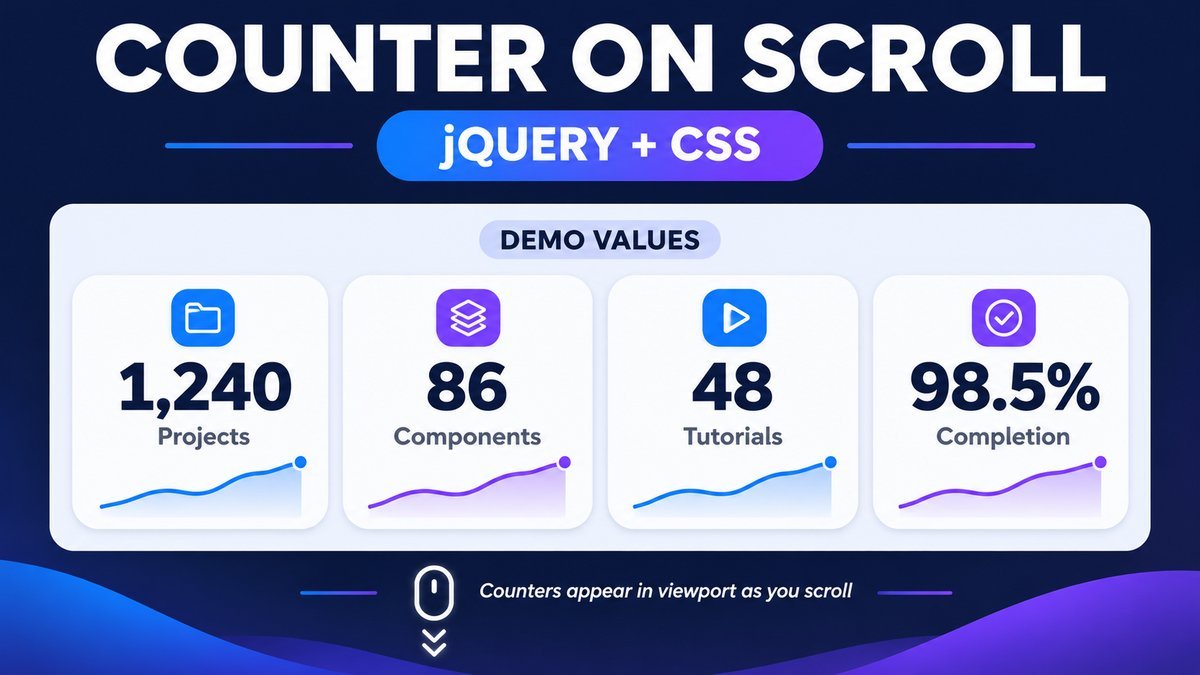
Start a statistic counter on scroll by observing when its cards enter the viewport, then animate from zero to a fixed target with requestAnimationFrame. jQuery can handle the replay controls and component selection, while Intersection Observer handles visibility without a page-wide scroll listener.
This example counts once, supports decimals and a percentage suffix, includes a stop-to-final control and respects reduced motion. The final values are already in the HTML, so the information remains readable without JavaScript. The demo numbers are illustrative, not SanWebCorner business statistics.
Try the counter-on-scroll live demo
Counter-on-scroll playground
Bring the cards into view to count up once. Replay animation starts another run; Show final values stops it immediately.
Illustrative demo values only — these are not SanWebCorner business statistics.
- Projects
- 1,240
- Components
- 86
- Tutorials
- 48
- Completion
- 98.5%
Final values remain readable before enhancement.
The animation lasts 1.6 seconds and starts automatically at most once. Reduced-motion preference shows final values immediately. Screen readers receive the final statistics instead of every animated number.
Keep the statistics useful before adding animation
A counter is a presentation effect, not a source of data. Write the accurate final number and its label in the HTML first. Then add motion as an optional enhancement. Never invent customer counts, years of experience or completion rates to make a card look impressive.
The sample figures here are deliberately marked as illustrative. In a real website, explain what each value measures and maintain it from a trustworthy source. A visually polished number can still mislead if its label or reporting period is unclear.
1. Put final values and animation targets in the markup
<dl class="stats">
  <div class="stat-card">
    <dt>Projects</dt>
    <dd>
      <span class="counter" aria-hidden="true"
            data-target="1240" data-decimals="0">1,240</span>
      <span class="visually-hidden">1,240</span>
    </dd>
  </div>
</dl>
The definition list pairs a statistic label with its value. The visual span can change during counting, while the accessible text stays at the final value. That avoids repeatedly announcing intermediate numbers. Do not use display:none on the accessible text; the source uses a visually hidden utility that retains it in the accessibility tree.
Store an unformatted numeric target such as 1240 in the data attribute. Commas and percent signs belong in display formatting, not the numeric value used in the calculation. The complete example uses a separate suffix attribute for the percentage card.
2. Create a responsive card grid
.stats {
  display: grid;
  grid-template-columns: repeat(auto-fit, minmax(min(100%, 170px), 1fr));
  gap: 16px;
}
.stat-card {
  min-width: 0;
  padding: 26px 18px;
  border-radius: 14px;
  background: #183154;
  color: white;
  text-align: center;
}
.counter {
  font-variant-numeric: tabular-nums;
  white-space: nowrap;
}
The grid fits as many cards as the container allows and stacks them when space becomes limited. Tabular numerals give digits consistent widths where the chosen font supports them, reducing distracting movement as numbers change. Reserve enough space for the largest formatted value and test longer translated labels.
3. Observe when the cards enter the viewport
var observer = new IntersectionObserver(function (entries) {
  entries.forEach(function (entry) {
    if (entry.isIntersecting) {
      observer.disconnect();
      startCounting();
    }
  });
}, { threshold: 0.1 });
observer.observe(document.querySelector('.stats'));
The MDN Intersection Observer guide explains asynchronously observing an element’s intersection with a viewport or ancestor. A threshold of 0.1 requests notification around ten percent visibility. Observing the card area rather than a large surrounding article makes the trigger more practical on small screens.
Disconnect after the first start so scrolling away and back does not replay the counters indefinitely. The demo also disconnects when the user starts a manual replay or requests final values. If observation is unavailable, it preserves the final numbers and still offers manual replay where animation support exists.
4. Animate by elapsed time, not by fixed increments
var start = null;
var duration = 1600;
function tick(timestamp) {
  if (start === null) start = timestamp;
  var progress = Math.min((timestamp - start) / duration, 1);
  var eased = 1 - Math.pow(1 - progress, 3);
  paintValues(eased);
  if (progress < 1) {
    frame = requestAnimationFrame(tick);
  } else {
    paintValues(1);
  }
}
frame = requestAnimationFrame(tick);
The MDN requestAnimationFrame reference describes scheduling an update before a repaint. Use its timestamp to calculate progress so the animation duration is based on elapsed time rather than the number of frames a device happens to render.
The easing formula advances quickly at first and slows near the target. At completion, paint the exact target explicitly. Do not depend on the last rounded intermediate frame to happen to equal the final result.
5. Format integers, decimals and suffixes deliberately
var formatter = new Intl.NumberFormat('en-US', {
  minimumFractionDigits: decimals,
  maximumFractionDigits: decimals
});
var scale = Math.pow(10, decimals);
var displayed = Math.round(target * progress * scale) / scale;
numberElement.textContent = formatter.format(displayed) + suffix;
In the demo, three cards use whole numbers and Completion uses one decimal place plus a percent sign. Keeping the chosen precision consistent avoids a changing number of decimal places during counting. Use the locale and number format appropriate to your actual audience and data.
The source is designed for finite nonnegative values up to one billion and zero to two decimal places. If your data includes negative values, currencies, very large magnitudes or changing live values, define and test those requirements separately instead of silently adapting a display example.
6. Stop old animation frames before replaying
function stop() {
  if (frame !== null) {
    cancelAnimationFrame(frame);
    frame = null;
  }
  if (observer) {
    observer.disconnect();
    observer = null;
  }
}
Replay first cancels any pending frame, then begins from zero. Show final values cancels the frame and paints each target immediately. This prevents rapid clicks from starting competing loops or adding the target to a value left from an earlier run.
The controls are native buttons, so Tab, Enter and Space work without a custom keyboard model. Focus stays on the activated button. When the page becomes hidden, the demo finishes at its final values and does not automatically replay on return.
7. Respect reduced motion and avoid noisy announcements
var reduced = window.matchMedia('(prefers-reduced-motion: reduce)');
if (reduced.matches) {
  paintValues(1);
} else {
  startCounting();
}
The full script checks this preference before every run and finishes immediately if the preference changes during a count. The MDN reduced-motion reference describes the user preference to minimize nonessential motion. A counter does not need motion to communicate its value.
A separate polite status reports the start, completion or stop action. The numbers themselves are not a live region. Screen readers receive the final values through stable text, and the same information remains visible when scripts are unavailable.
Download and test the complete source
Extract the ZIP and open index.html. The package includes HTML, CSS, JavaScript, a scroll-trigger fixture, a script-free fallback page, a README and local jQuery 3.7.1 with its MIT license. The pinned library is for this tutorial and is not a claim about the latest release.
Open scroll-fixture.html to test the intentional spacer above the cards. The animation should start only after the card area enters view, then remain complete when you leave and return. The script-free page should show all final values with no inactive replay buttons.
On WordPress, use the existing jQuery instance instead of adding a duplicate. A maintained theme or plugin should enqueue the component assets and preserve the scoped selectors and unique heading IDs. No Bootstrap, Counter-Up, Waypoints, icon library or external font is required.
Common counter problems and fixes
- The count restarts every time you scroll: disconnect the observer after the first run.
- Repeated clicks make numbers race: cancel the previous animation frame before starting another run.
- The last number is slightly wrong: explicitly write the exact target when progress reaches one.
- Decimals flicker: use an explicit precision and formatter.
- Nothing appears without JavaScript: put the final formatted value in the initial HTML.
Frequently asked questions
Does this counter require a scroll event handler?
No. Intersection Observer detects when the cards enter view. requestAnimationFrame handles the short number animation, and jQuery binds the demo controls.
Will it animate each time the section is visible?
No. It starts automatically at most once. Use Replay animation to run it again deliberately.
Are the numbers live analytics?
No. They are fixed illustrative values. Real metrics need a separate reliable data source and accurate labels.
What happens with reduced motion or no JavaScript?
The final values remain readable. Reduced motion skips counting, and the script-free version retains the original final HTML values.
Related tutorials
Continue with a responsive call-to-action section or a moving slider with CSS and jQuery for more component examples.